>>> Nifty Daily Chart <<<
>>> Click the chart to see on full screen <<<
So whats happening on Market. Why Nifty fell down so drastically today on Expiry Day. Every one had a big question. So here is the answer for all your doubts and queries.
Above is a daily chart of Nifty. Wave C took nifty to a new high of 9119 on 04th March, 2015. Today Nifty made a low of 8326, almost a 793 Points fall in less than a month. Nifty cooled of heavily and touches the Trend line support today.
>>> Nifty Hourly Chart <<<
>>> Click the chart to see on full screen <<<
So the above hourly chart tell us how Wave (X) was defined. Made a Low of 8326 and filled the gap as shown above. Let's see more details on 5 mins chart.
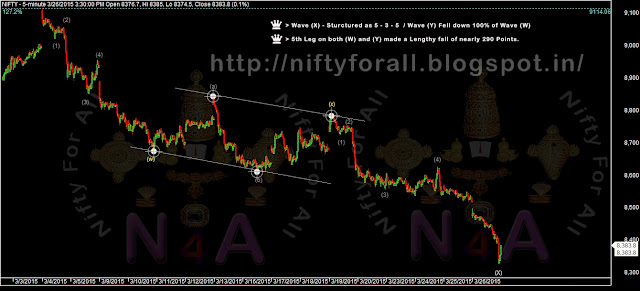
>>> Nifty 5 Mins Chart <<<
>>> Click the chart to see on full screen <<<
5-3-5 was well explained on the above 5 mins chart. 5th wave on both (w) and (y) had a length of nearly 290 points. So overall figure tell us the Bulls are still healthy and alive. Lets wait and see.
>>> Bank Nifty Hourly Chart <<<
>>> Click the chart to see on full screen <<<
Nothing more to say about the above chart. Its an A-B-C and C wave made a 100% fall of Wave A. So what else left to say in this chart. Only 1 word left to say. BUY. Cheers!!!


