>>>Weekly - Nifty <<<

>Click the chart to see on full screen<
Weekly Chart of Nifty Shows the Resistance as Previous high 5944.
If able to cross the Resistance then it should touch the Upper Channel as shown on Chart - Possibly 6030 Next Week.
On 28th November,2012 wrote in the Blog as "Crouching Bull Hidden Bear" See the Below link for details
http://niftyforall.blogspot.in/2012/11/crouching-bull-hidden-bear.html
as 600 Point Rally as it was a Bullish Flag Pattern as below

>Click the chart to see on full screen<
So far we had almost 223 Points Rally from 5727 to 5950. So whats Next ???
>>>Daily Nifty <<<

>Click the chart to see on full screen<
Nifty - Daily Chart suggest 5940 as Resistance and 5815 as a Support for Next Week. Cross above 5940 may give another 90 Points Rally till 6030.
>>> Hourly - Nifty <<<

>Click the chart to see on full screen<
Above given is a Hourly Nifty Chart. I have given two Possibilities as below
>>> Nifty may test 5815 if the 4th sub wave shall be divided as a-b-c-d-e.
>>> Nifty may continue as 5th sub wave if the support 5880 or 5860 holds.
Lets see.
>>>Bank Nifty <<<
Written on 29th Nov, in "Its a Warning to Bear" about Bank Nifty, Else click the Below Linke to see it http://niftyforall.blogspot.in/2012/11/its-warning-to-bear.html as chart given below

>Click the chart to see on full screen<
As Mentioned Triangle break should give a 1000 Point Rally, means almost after break out has ran up 500 points so far. So whats next.

>Click the chart to see on full screen<
Now Bank Nifty facing resistance near 12470-80 and 12800. Support at 11475.
>>> BANK STOCKS <<<
It should be agreed that Bank Stocks played major role in this rally like SBI, ICICI and Axis Bank. Lets see how its going to be on next week.
As Govt had successfully passed the FDI in Retail both in Lokh sabha and Rajya Sabha, Govt now keen to pass the Insurance and Pension bill in Parliament.
Also there is a huge expectation that RBI may slash the Interest rate in coming week, which may increase the Positive sentiment in the market.
So above all are very important for market as well as the Bank Sector in Particular. So lets see some major Blue chip Bank stocks this week
>>>SBIN<<<

>Click the chart to see on full screen<
State Bank Of India - Weekly Chart shows a triangle Pattern. 2340 act as a Stiff Resistance. Break above shall give a Big Bull Rally. Fail to break the Resistance Line may test 1950 approx.
>>> ICICI BANK <<<
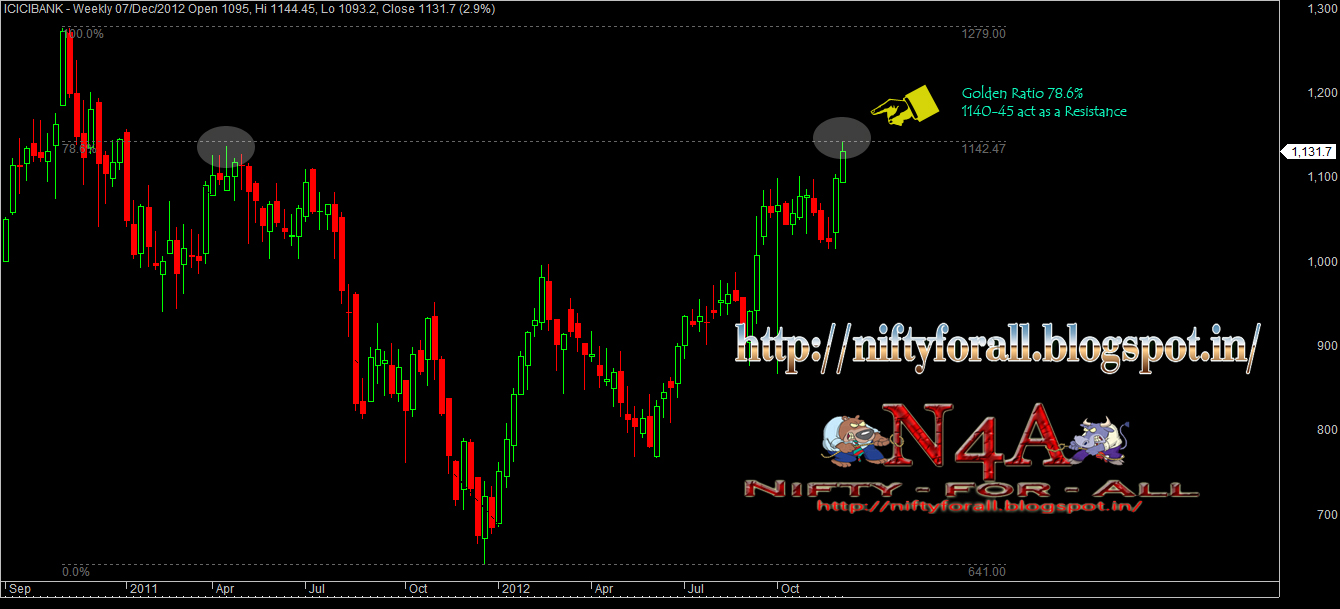
>Click the chart to see on full screen<
Again the Weekly Chart of ICICI Bank shows the Price was resisted on a 78.6% Golden Ratio. 1140-45 act as a Stiff Resistance.
>>>AXIS BANK <<<

>Click the chart to see on full screen<
Axis Weekly Chart shows a Resistance as Previous High 1367, cross above may test the golden ratio 78.6% or 1432.
Lets See!!! Cheers!!!